State Coincident and Leading Indices
The goal: reimagine the visualisations for the State Coincident and Leading Indices.
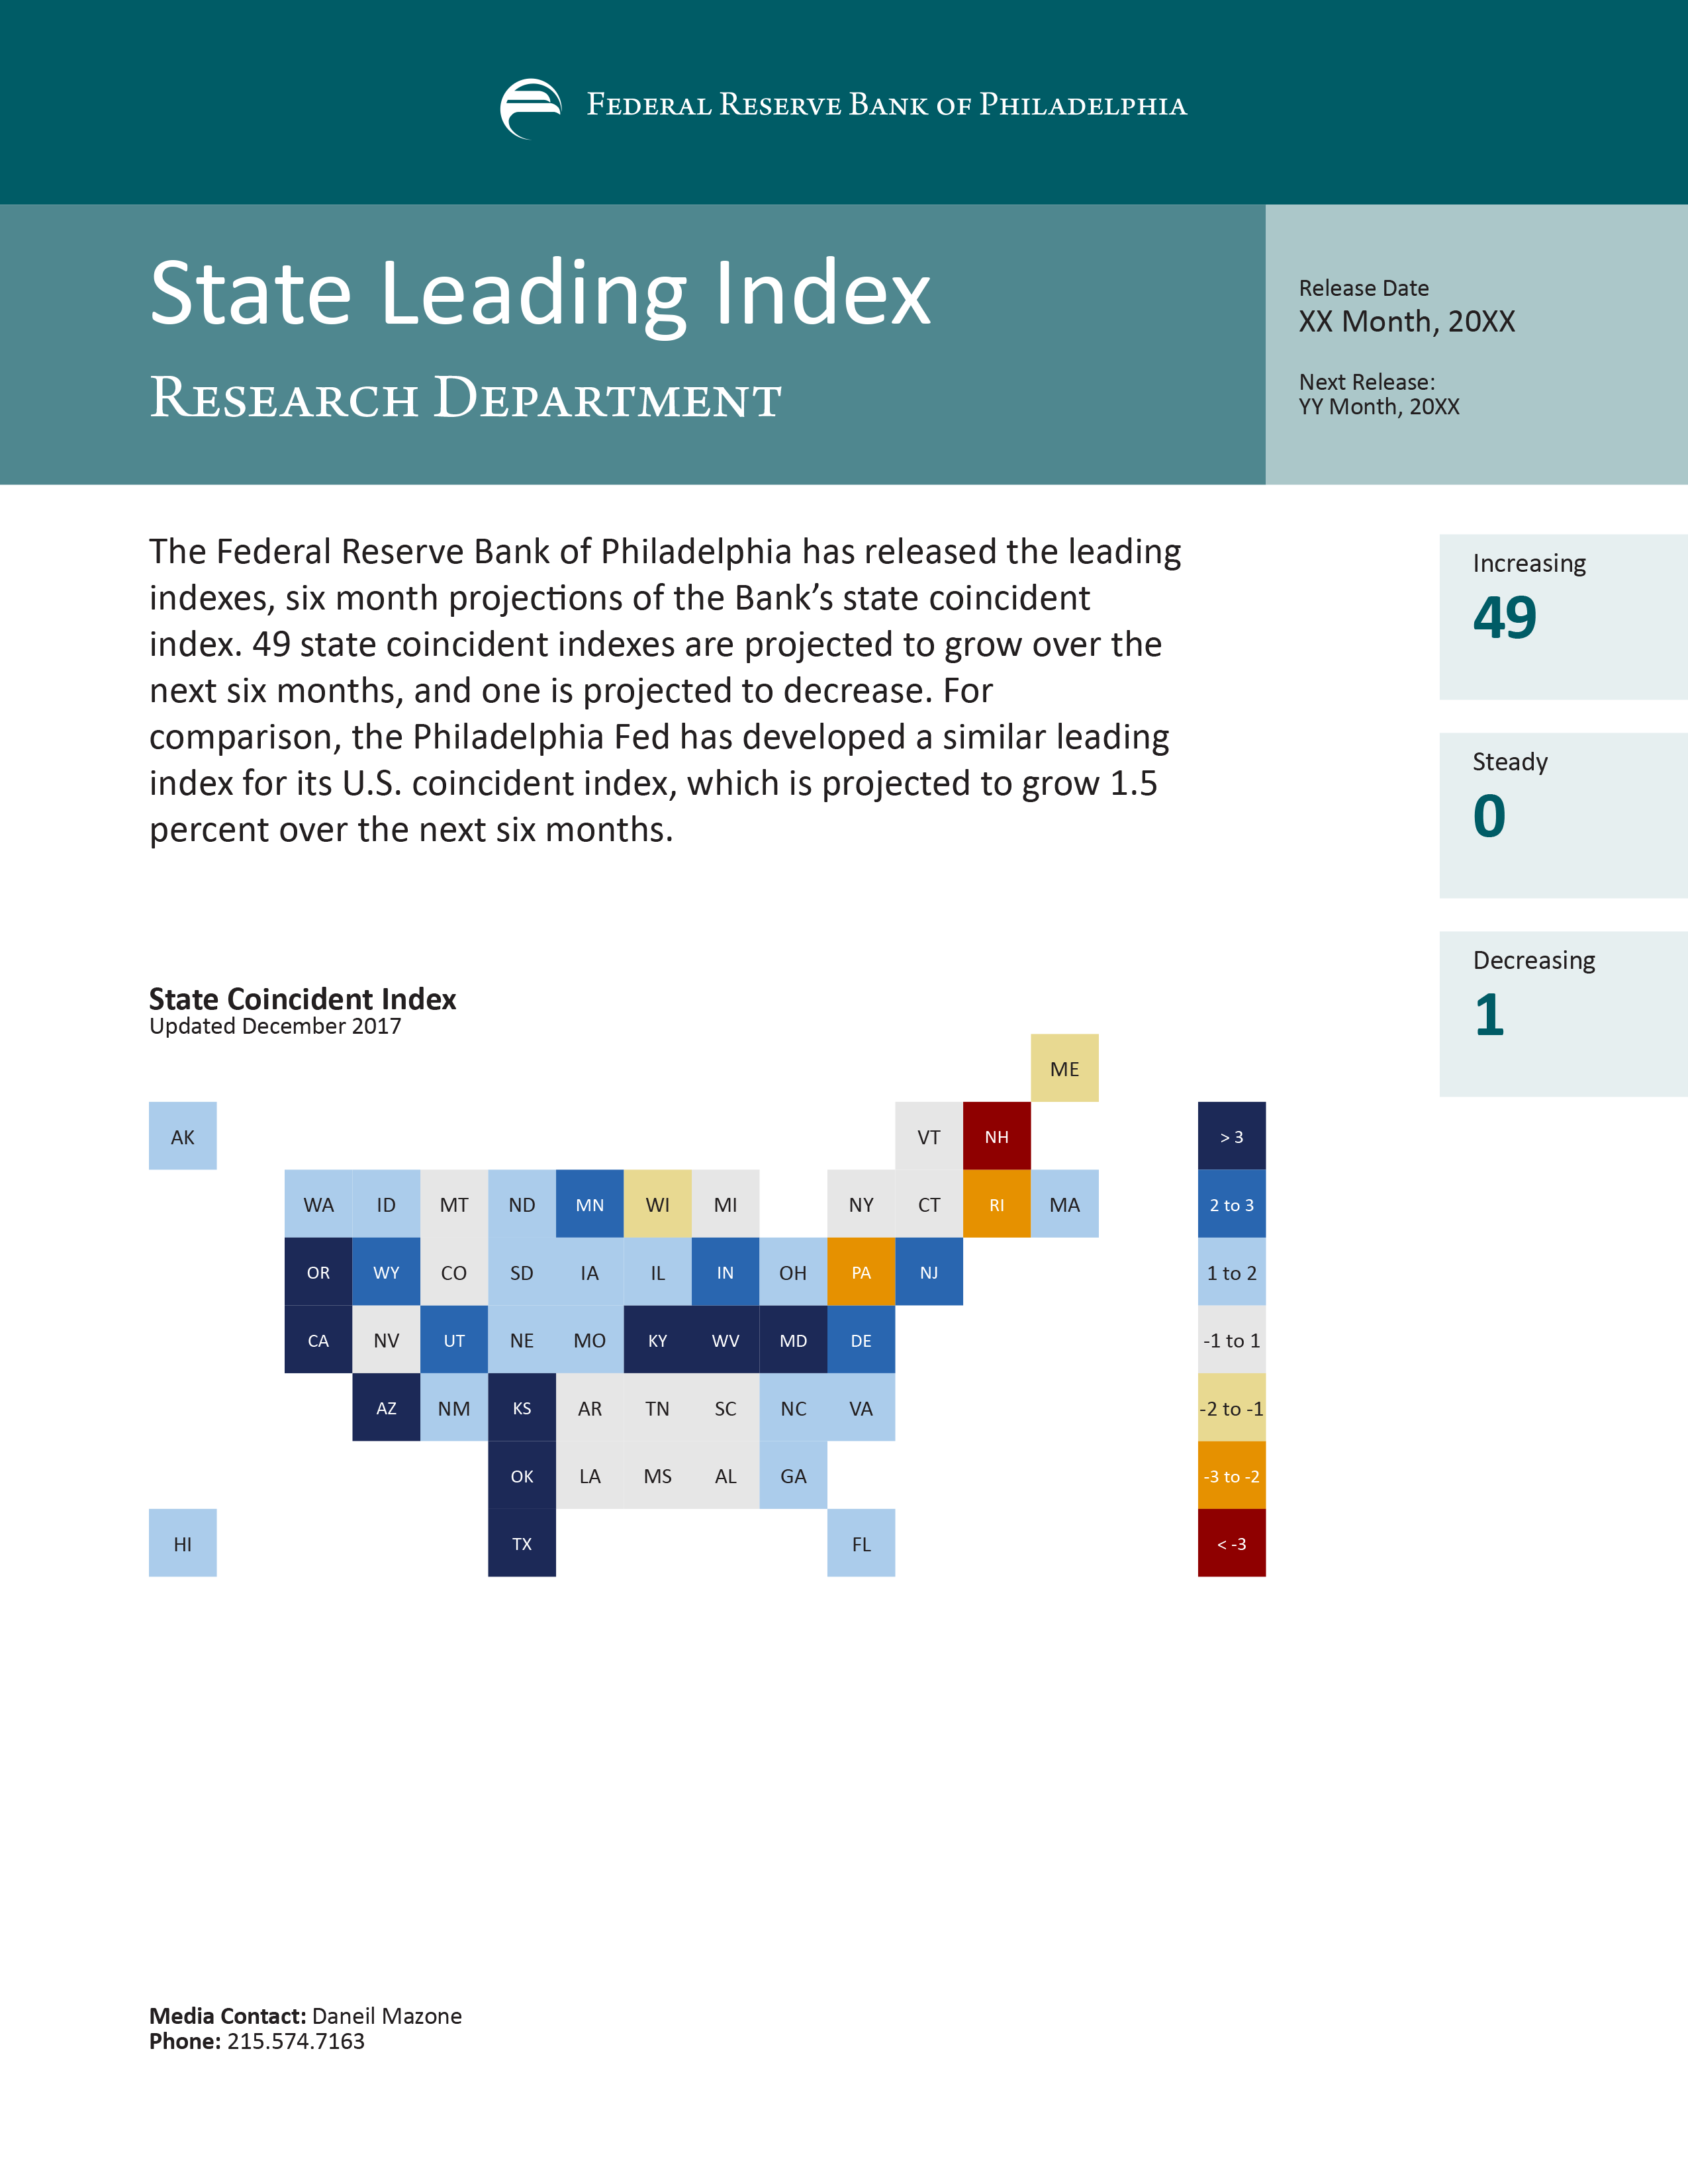
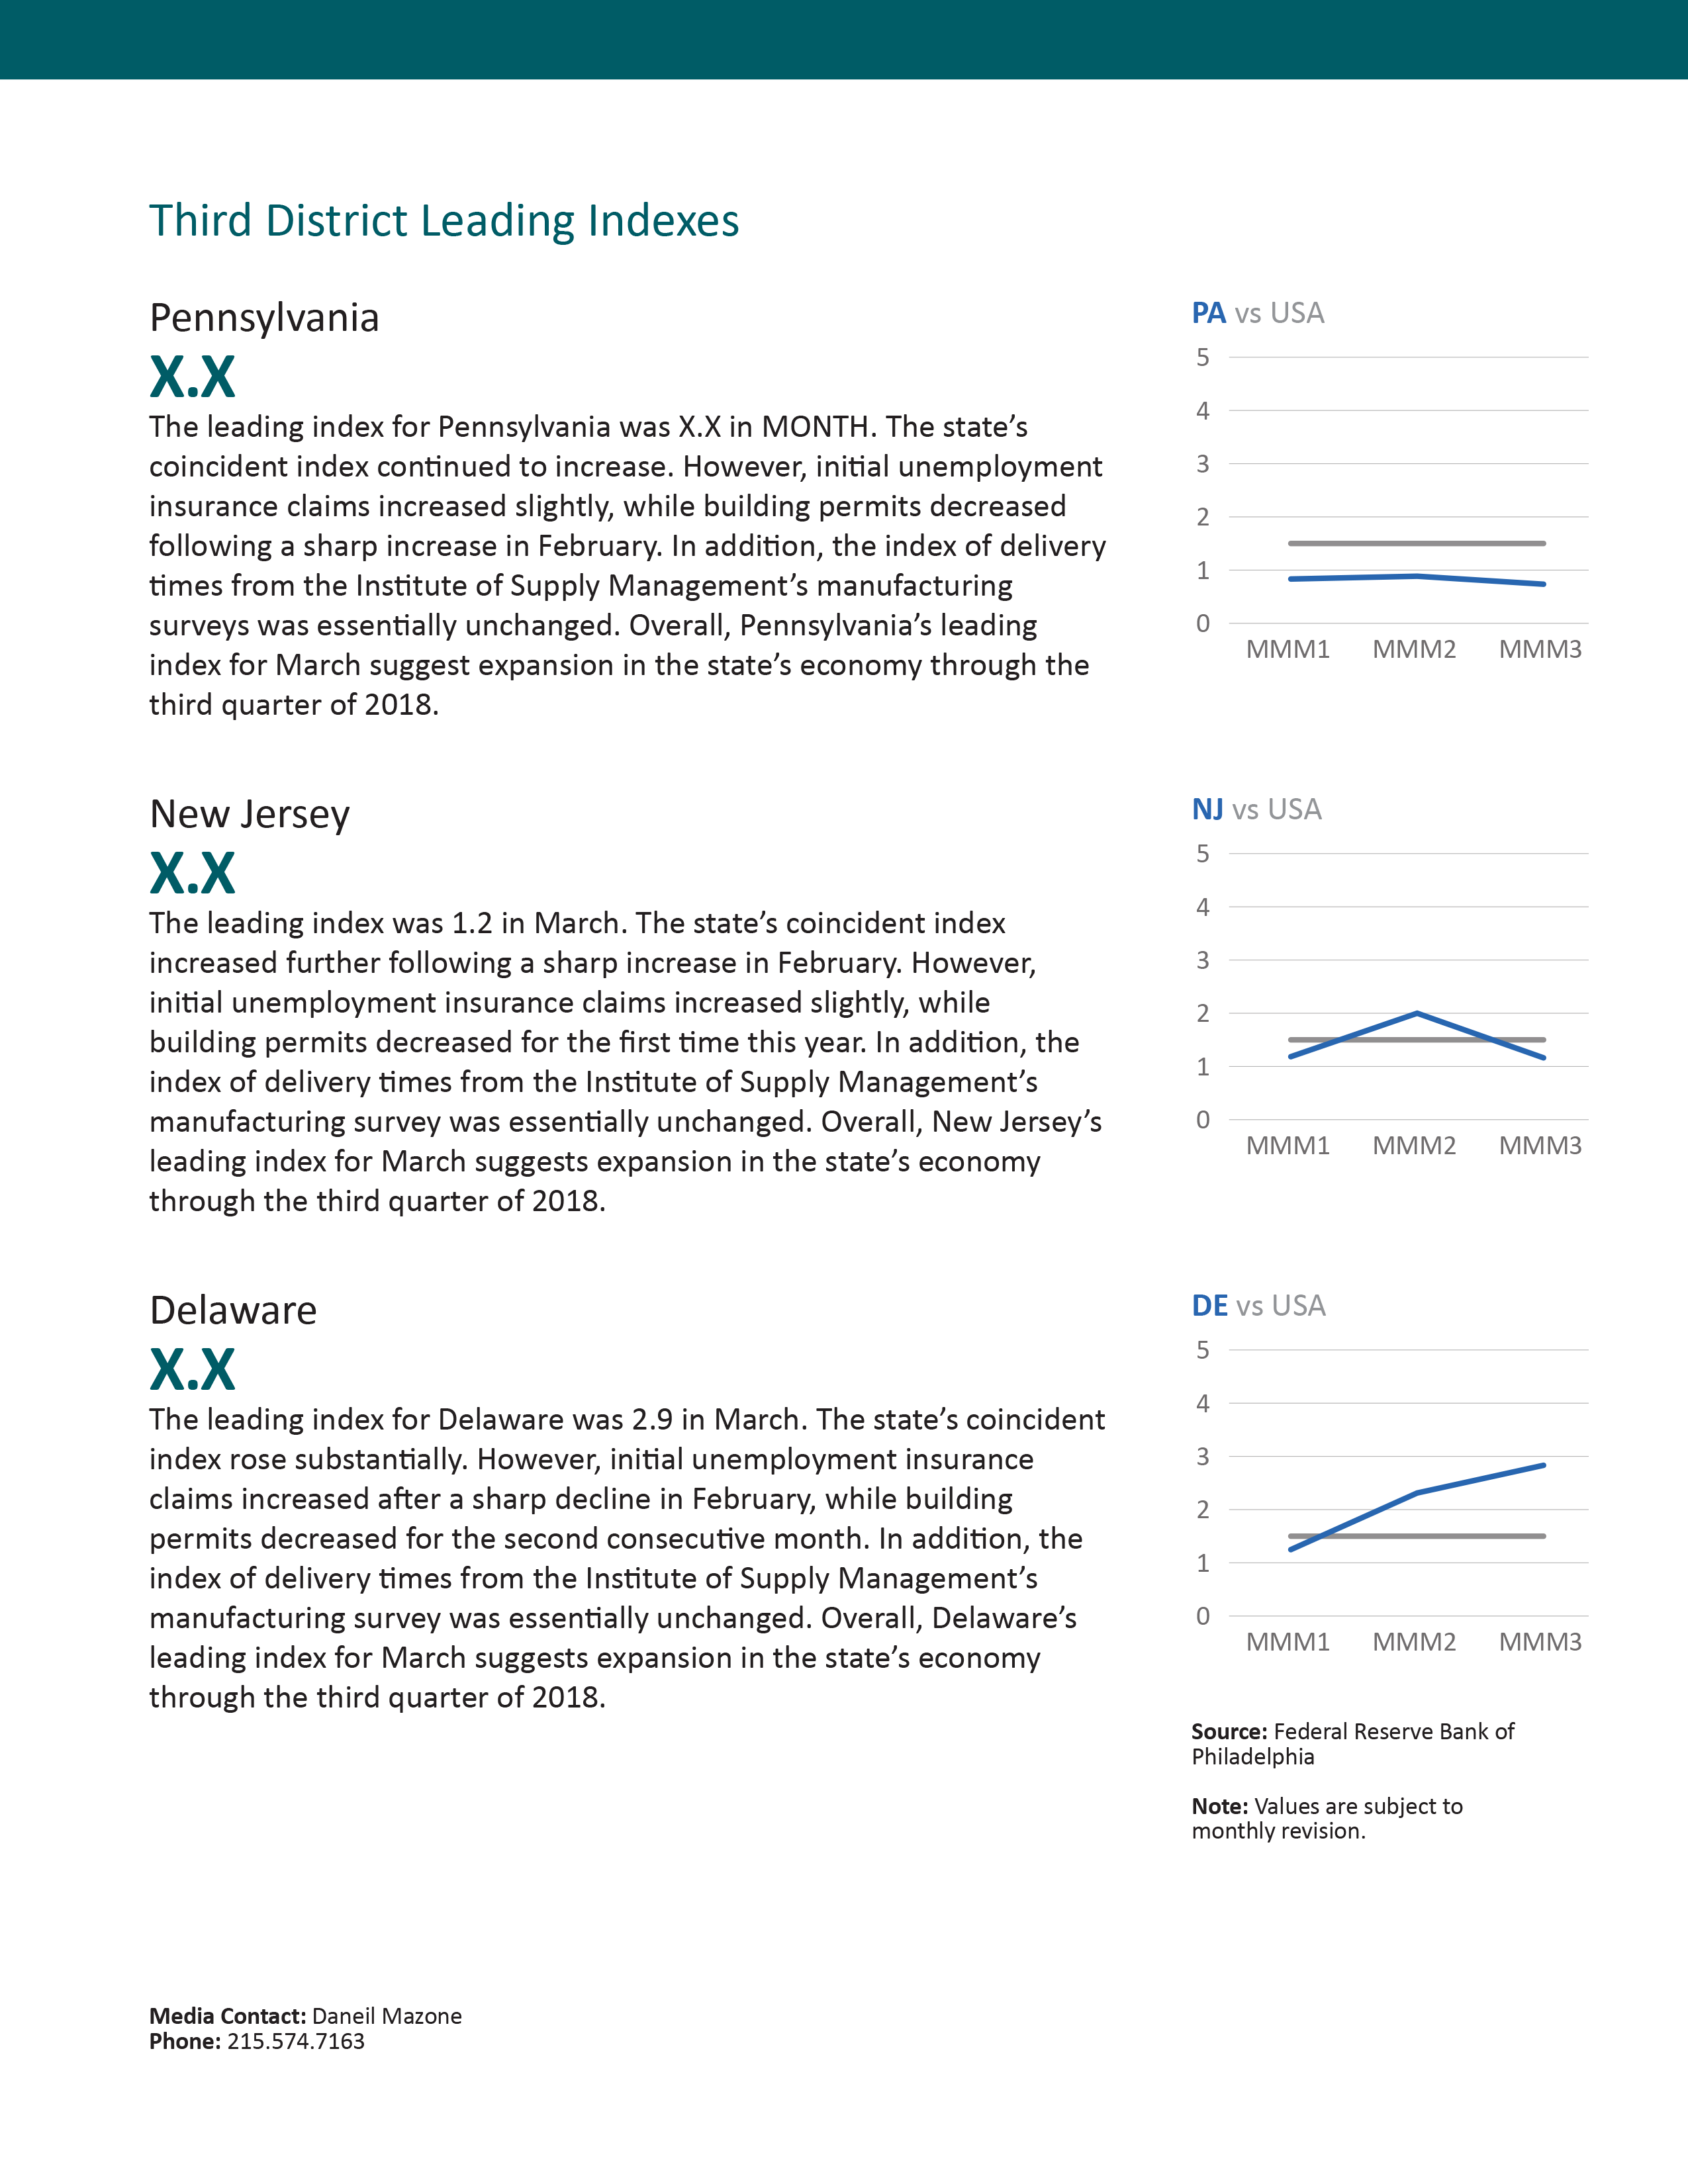
In addition to using my team’s first building blocks established with GDPplus and the Partisan Conflict Index, I designed our second new block—what became commonly called the “box map”—to create the data display for the indices, which incorporated both the new box map and the line chart. Together they showed the economic conditions across all 50 states and what they forecast for the following six months.
My Function
- Creative director
Design Team
- Designer
- Developer
Skills Applied:
- Design management
- Editorial design
- Information design
- Product design
- UX/UI design
- Data visualisation
Building a Bigger Environment
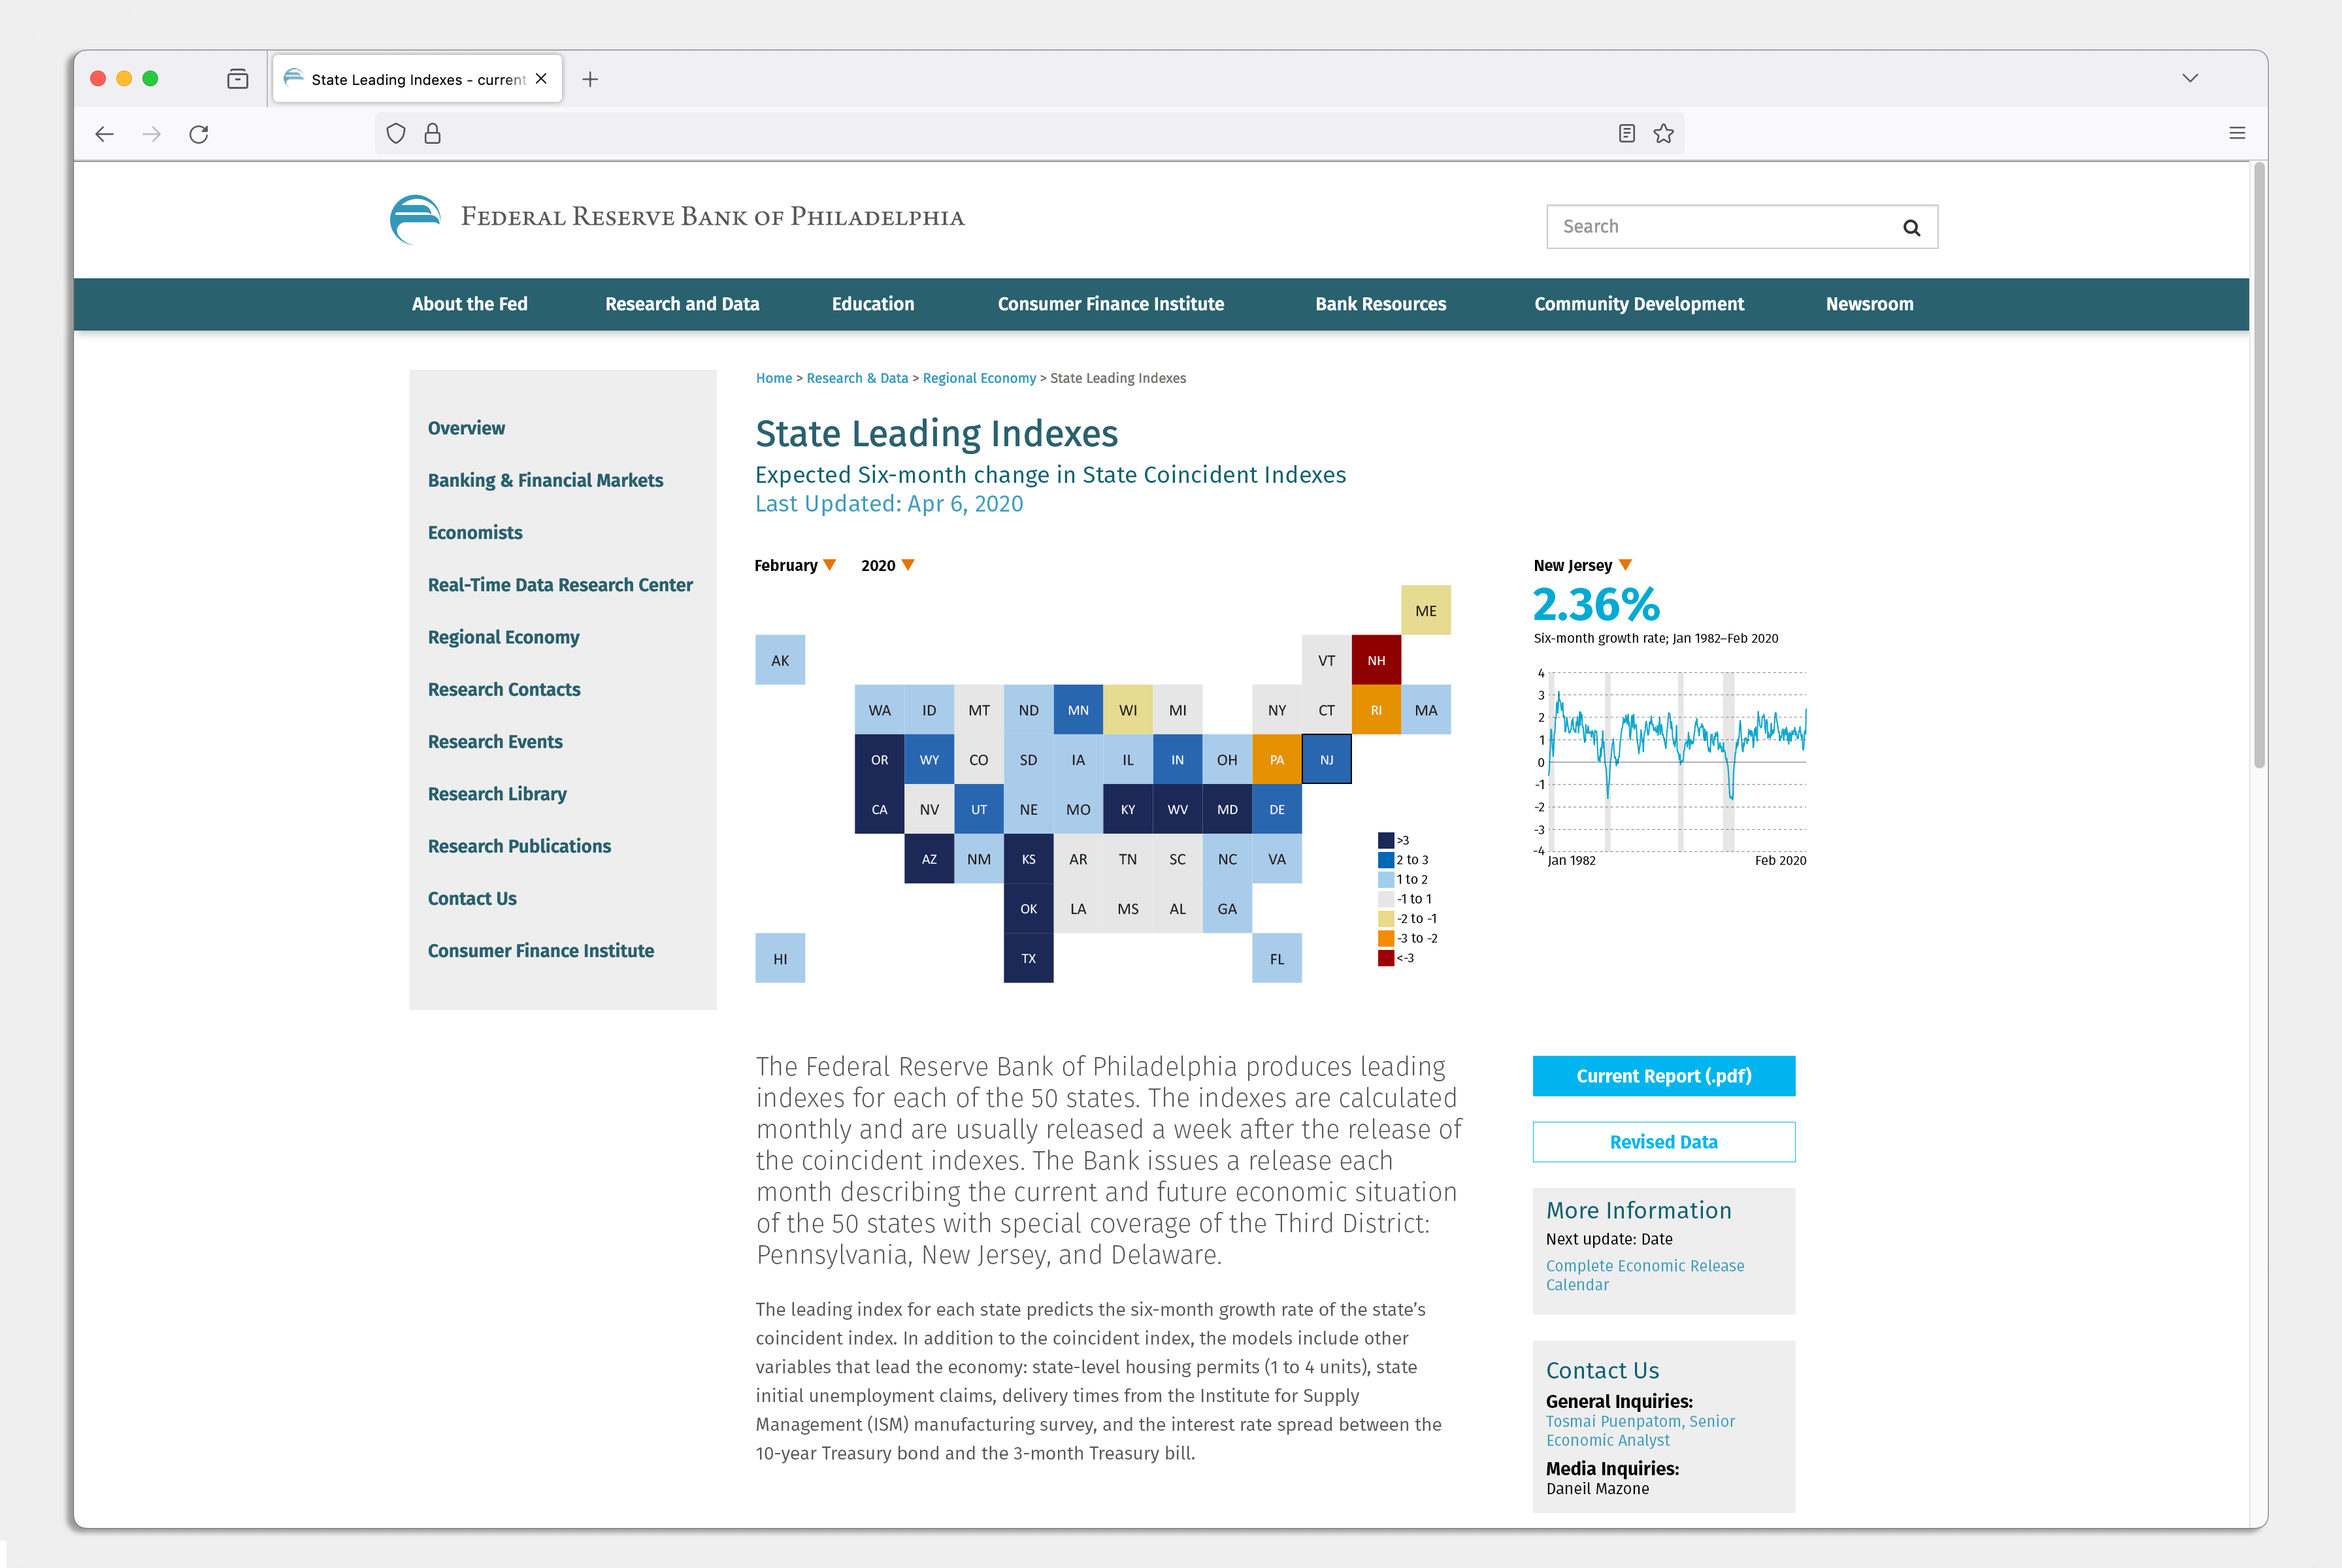
I designed and developed a new page template for Research Department products to launch with the state coincident and leading indices. The page served as a content hub with access to the latest data via the new interactive map and chart, downloadable reports and data, and access to the new Economic Release Calendar.
The Third District of the Federal Reserve faces a particular challenge when representing the states it covers—Pennsylvania, New Jersey, and Delaware—via maps. New Jersey and Delaware rank among the two geographically smallest states and the Philadelphia Fed covers only half of New Jersey. The box map, as the design came to be called, addressed the issue by setting all states to the same size. We labelled each box and offered a drop down menu to select states in case users could not find a state of interest.
In addition to the online version, I created a Microsoft Word template for use by the product team to create their .pdf reports. Complementing this, I also designed an Excel template offering a branded deliverable to unify the product’s touchpoints into a cohesive experience. Finally, the project incorporated new language for the webpage with the aim of speaking more plainly to an interested but non-academic audience.
Final Project Deliverables
- Two interactive charts
- New page/content hub template
- New Word/.pdf template
- New Excel template