
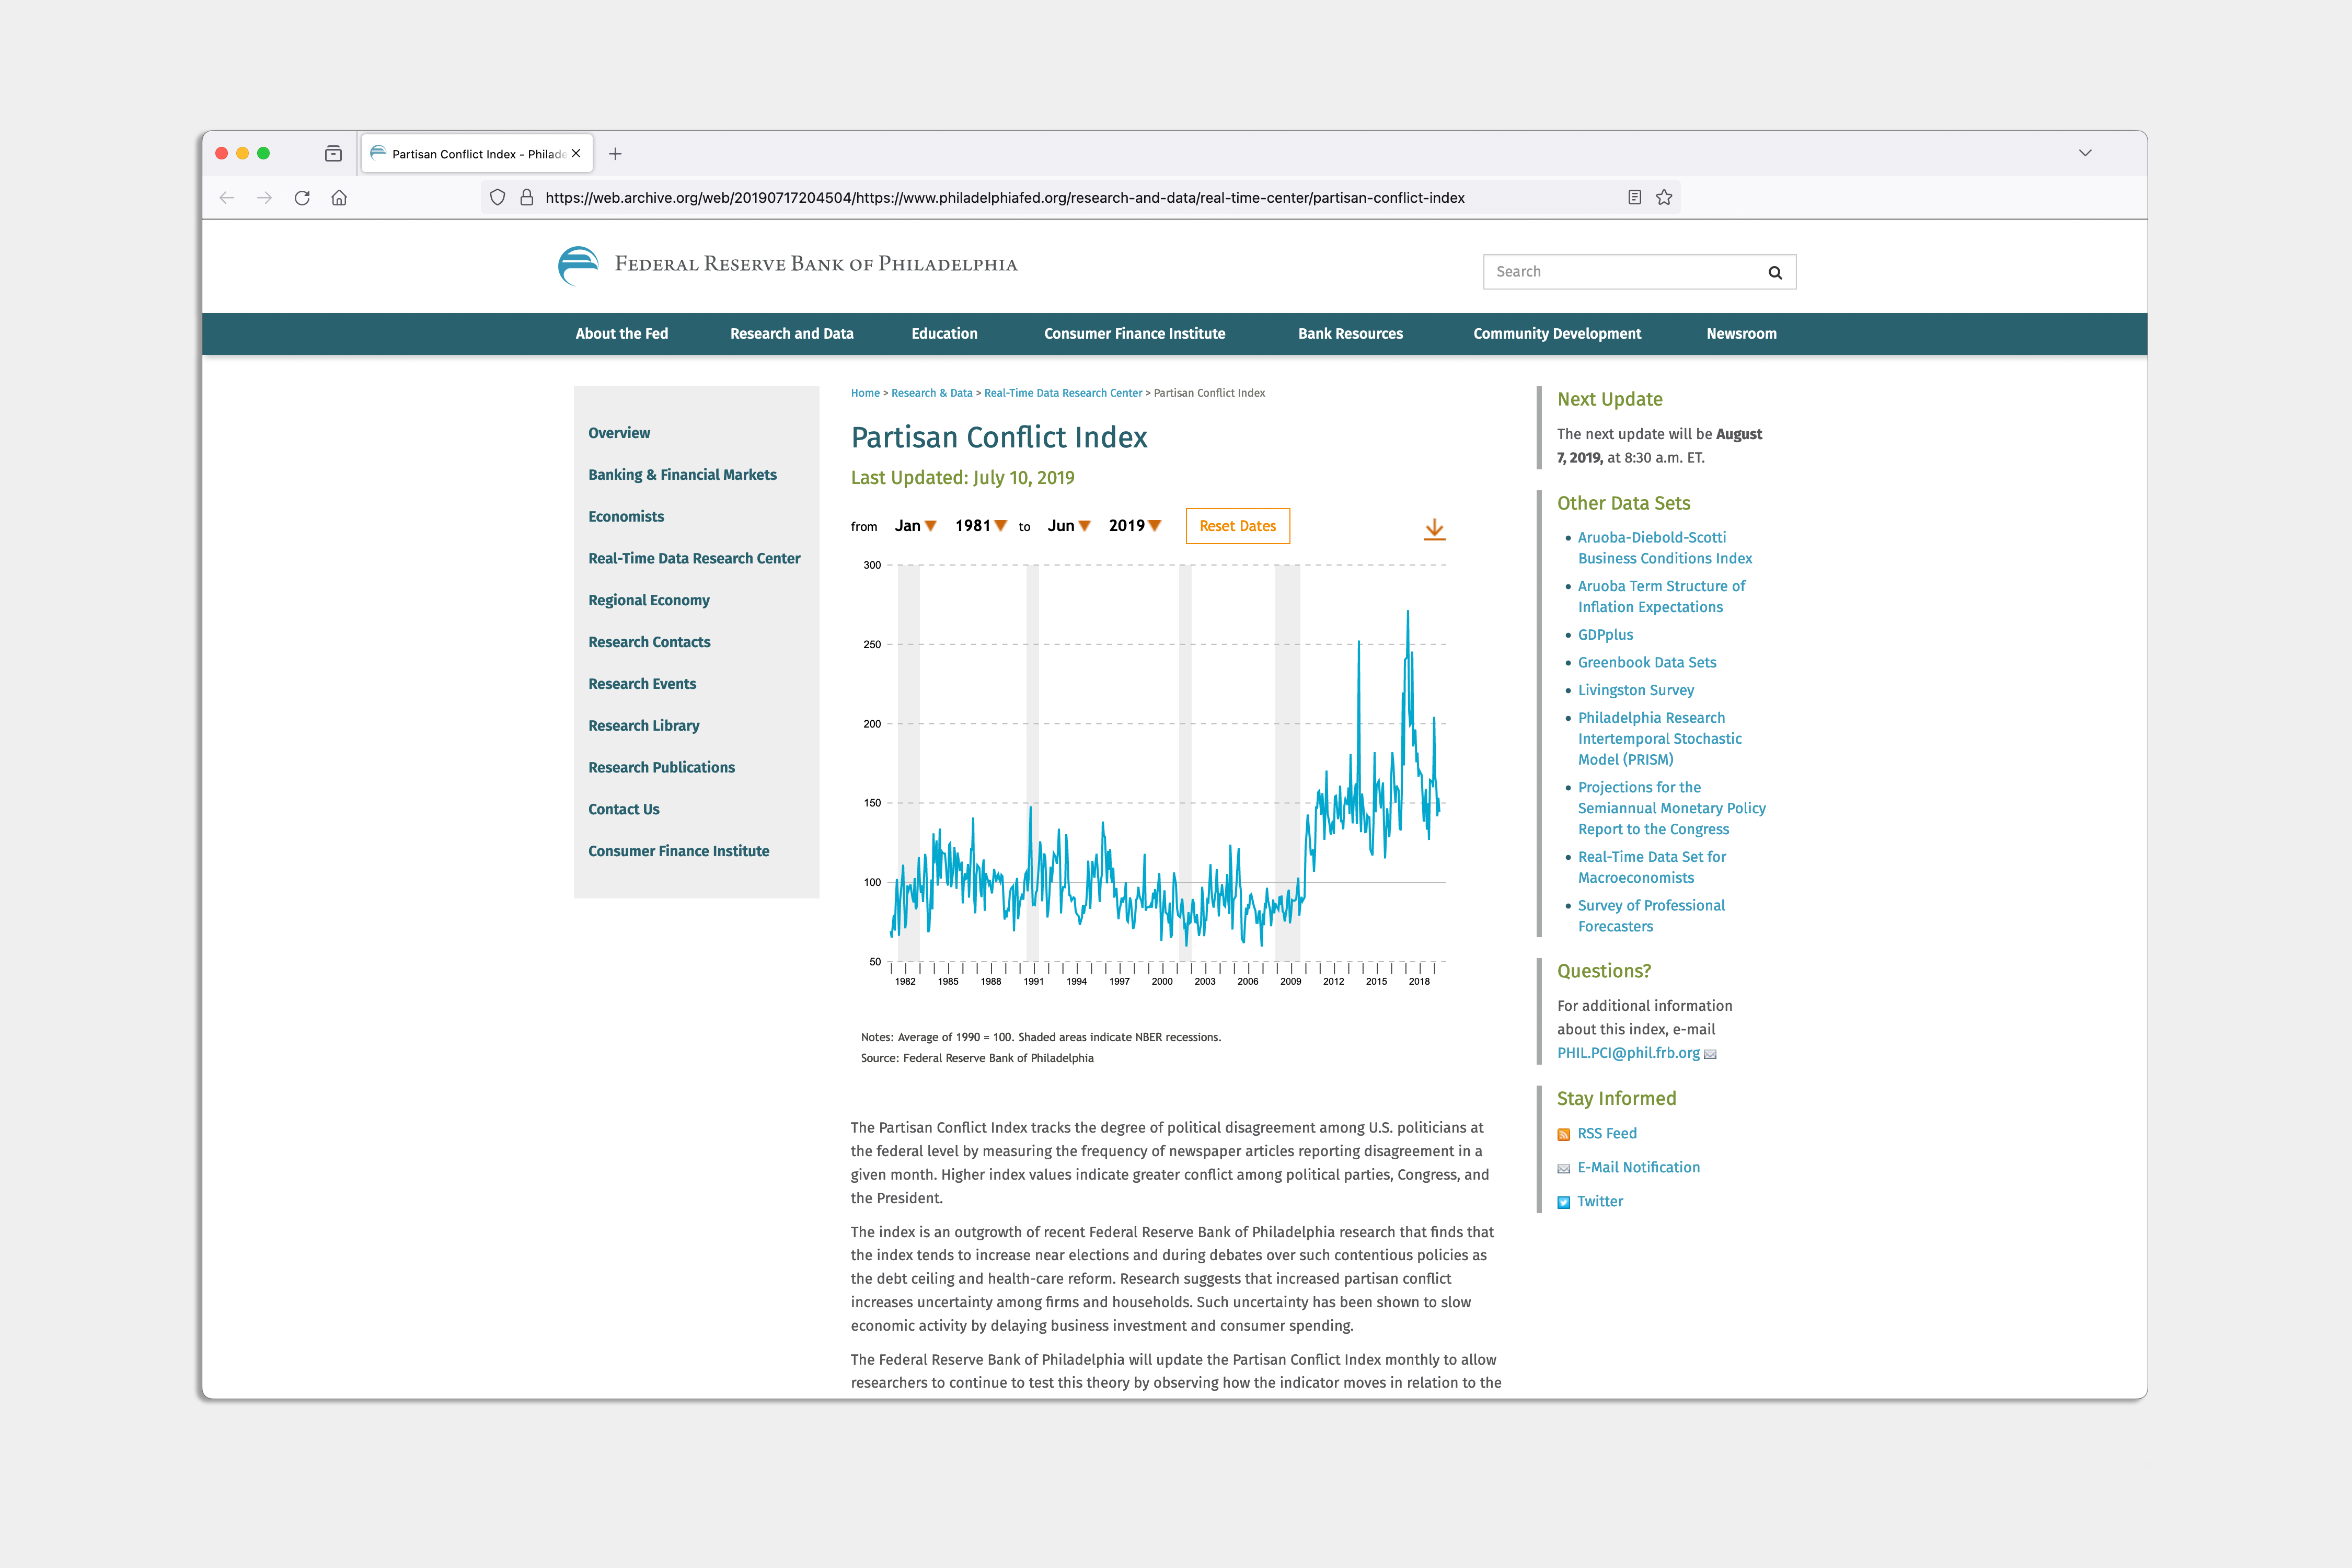
The Partisan Conflict Index
The goal: create the Philadelphia Fed’s second true data-driven interactive web-based application for the Partisan Conflict Index (PCI).
My team utilised our first “building block” from GDPplus and rapidly designed, developed, and launched the PCI, proving our approach to leadership and stakeholders, the next step towards a complete reimagining of the Economic Research Department’s online presence and digital communications.
Design Team
- Designer
- Developer
Skills Applied
- Design management
- Information design
- Product design
- UX/UI design
- Data visualisation
I led the small team tasked with bringing the index alive on the web, designing an updated display with improved more plain language text supporting the product.
A former Philadelphia Fed research economist created an index tracking the level of partisan disagreement at the federal level because evidence suggests high levels of partisan conflict create economic uncertainty for households and firms. That uncertainty leads to reduced consumer spending and business investment, which then drags the economy down.
For the index we used the tools created for GDPplus to quickly design and develop an interactive time series chart driven by JSON data. The design incorporated grey bars indicating recessions, but more contextual elements about political moments, e.g. election years, were, given the heightened sensitivity of politics and the Federal Reserve at the time, left to potential future upgrades. We designed the data update process to minimally impact and disrupt the production team, resulting in a more efficient means of producing the monthly updates to the research product.
A quietly useful tool for measuring the volume of our rancourous political discourse.